http://www.e-mri.org/cours/Module_4_Signal/ponderations4_en.html
As mentioned in the first week, in diagnostic ischemic heart disease, one important factor is to distinguish infarcted myocardium from viable myocardium. The ideal imaging method will clearly distinguish these two types of myocardium as shown below.
Using DE-MRI, this is achievable because Gadolinium injection makes infarcted myocardium having a much shorter T1. This results in infarted myocardium shows up bright while normal myocardium shows up dark. However, we need to acquire data at the right time to achieve the desired contrast. As shown in the figures below, if we acquire data at inappropriate time, we can not get the contrast as we want.
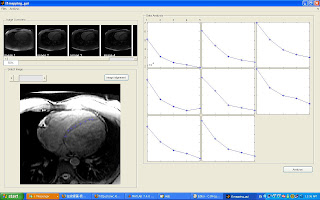
Therefore an imaging analysis tool is developed for T1 mapping analysis, the gui is shown below:


No comments:
Post a Comment